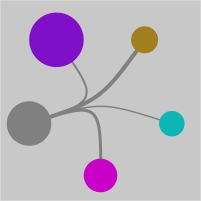
Voting trend visualisation
After every election, there is a poll resulting in a voter trend analysis. i always liked the graphs they made from the data on tv. This time i desided to make my own voter trend visualisation in processing.
i didn't know if i would be permitted to use actual data, so i used random() to generate it.

See also:
a circular chart im Processing
sine-function experiment
Calling R from Processing
projecting GIS Data on a sphere using Processing
processing ical-flowers-2.0
sine-function experiment
Calling R from Processing
projecting GIS Data on a sphere using Processing
processing ical-flowers-2.0


