
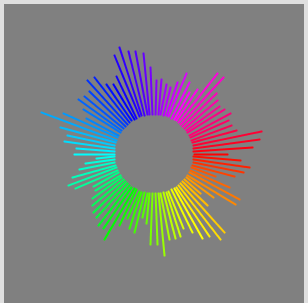
a circular chart im Processing
This is a rainbow colored circular bar-chart I made with processing. Currently the lenght of the bars are random numbers. So don't expect any fancy insights by watching the bars move :-)
click here to see it in action or download the source


See also:
sine-function experiment
Calling R from Processing
projecting GIS Data on a sphere using Processing
processing ical-flowers-2.0
Training Bike Visualization
Calling R from Processing
projecting GIS Data on a sphere using Processing
processing ical-flowers-2.0
Training Bike Visualization
rainbow colored circular bar-chart looks great and i liked it a lot.