rotated text in reportlabs
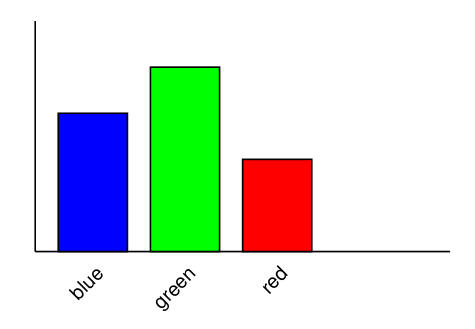
if you want to make a great chart like the one below in reportlab, you need rotated text. it isn't very complicated - its just a bit hard to find som examples on the net.
the canvas in reportlab has a saveState and a restoreState method, and supports rotate and translate similar to openGL or processing. see the code example below who it is done.
from reportlab.pdfgen import canvas from reportlab.lib.units import cm
c = canvas.Canvas("rotate.pdf")

c.line( 2*cm, 21*cm, 2*cm, 16*cm)
c.line( 2*cm, 16*cm, 11*cm, 16*cm )

c.setFillColorRGB( 0, 0, 1 )
c.rect( 2.5*cm, 16*cm, 1.5*cm, 3*cm, fill = 1 )
c.setFillColorRGB( 0, 1, 0 )
c.rect( 4.5*cm, 16*cm, 1.5*cm, 4*cm, fill = 1 )
c.setFillColorRGB( 1, 0, 0 )
c.rect( 6.5*cm, 16*cm, 1.5*cm, 2*cm, fill = 1 )

c.setFillColorRGB( 0, 0, 0 )

i=0
for str in ["blue", "green", "red"]:
    c.saveState()
    c.translate( (i + 3.5) * cm, 15.5 * cm )
    c.rotate( 45 )
    c.drawRightString( 0, 0, str )
    c.restoreState()
    i += 2

c.showPage()
c.save()


See also:
ReportLab Test
grease pencil experiment 6 - grid
grease pencil experiment 4 - filled shapes
grease pencil experiment 4 - depth of field
grease pencil experiment 3 - animated circles
grease pencil experiment 6 - grid
grease pencil experiment 4 - filled shapes
grease pencil experiment 4 - depth of field
grease pencil experiment 3 - animated circles