Animation Node experiment - closed curve
For this animation I used a pyhton script node to generated 3D coordinates for a closed curve you can download the blend file here

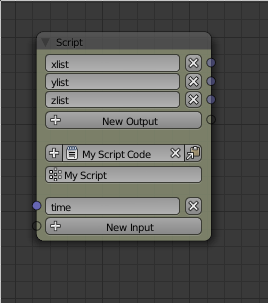
The node setup is very similar to my first python node example. I used a script node to generate 3 float lists one the x-, y- and z-component of the curve points and feed the results to a loop
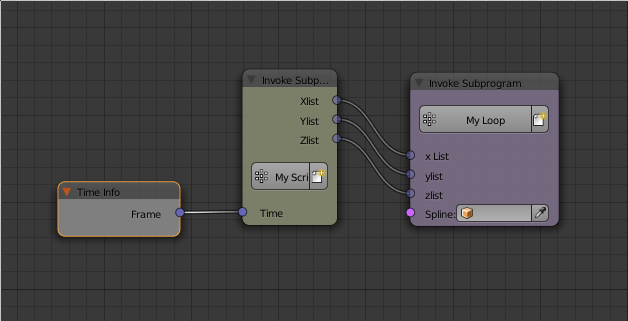
the script node gets the time as an input and creates the float lists using the following code
import math
lenght = 100
r =range(-40,40)

ylist = [2*math.sin(time/14+x/2+9)*math.cos( time/7 +x/10) for x in r]
xlist = [2*math.sin(time/13+x/2+7)*math.sin( time/7 +x/3 ) for x in r]
zlist = [2*math.cos(time/23+x/7+13) for x in r]
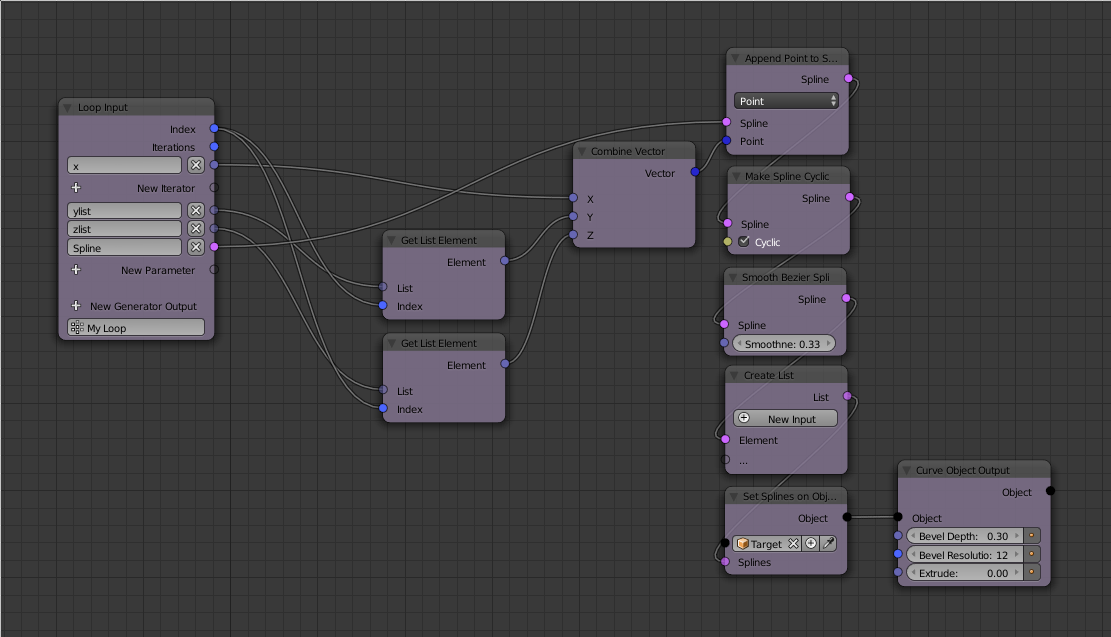
then I loop over the lists and create vectors which get combined to a spline and set to an object


See also:
Animation Node experiment - script node spiral
AN experiment - delayed instanciation
Animation Node experiment - circular sound visualizer
Animation Node experiment - polar coordinates
Animation Node experiment - cube grid
AN experiment - delayed instanciation
Animation Node experiment - circular sound visualizer
Animation Node experiment - polar coordinates
Animation Node experiment - cube grid