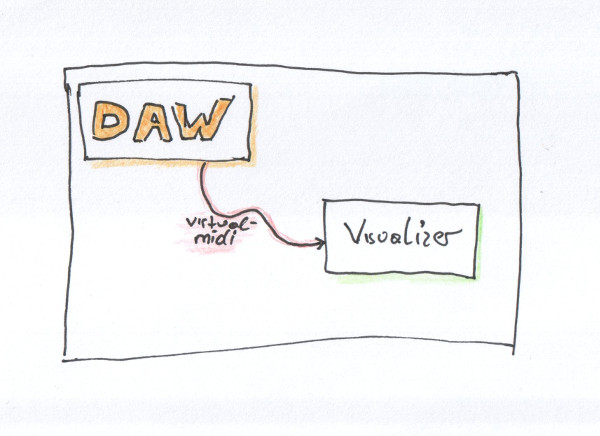
connecting linux midi programs using alsa virtual midi
alsa offeres a virutal midi device that can be used to connect several midi applications running on the same computer. This allows you to connect various standalone applications like DAWs, livecoding environments like sonic-pi, supercollider, pd, ... or visualization software and sending midi data between them.
Animation Node experiment - Music nodes
for this animation I used the "simple sound controller"-template from the animation nodes addon to control some objects by music. I rendered the 3 animations separately and cut them to the beat using the VSE
The track is recorded and mixed using bitwig-studio
you can download part1 ,part2 and part3 here

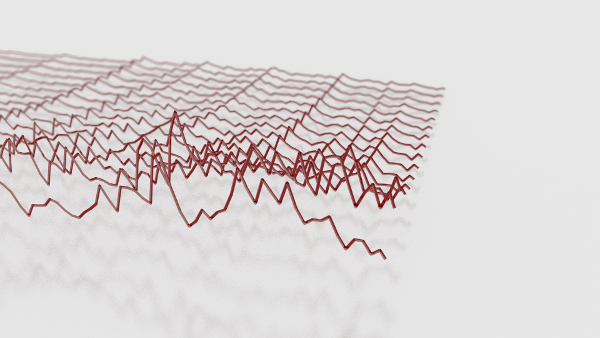
sound visualizer experiment 1
for this sound visualizer I created a python script that creates curves for 16 frequency bands of the sound file
The song can be heard in full length here
my script is based on the unbake f-curve script by liero
you can download the blend file here
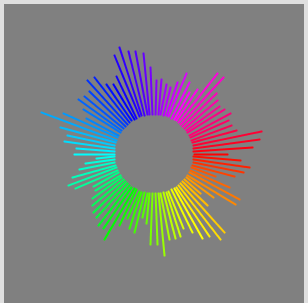
a circular chart im Processing
This is a rainbow colored circular bar-chart I made with processing. Currently the lenght of the bars are random numbers. So don't expect any fancy insights by watching the bars move :-)
click here to see it in action or download the source
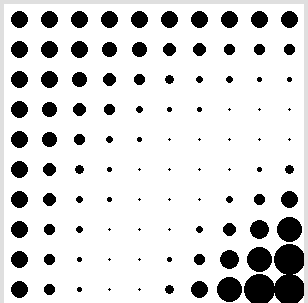
sine-function experiment
I played around with ways of visualizing 3D functions in 2D space. This is a visualization of the function f = sin(x*y * c1 + c2).
c1 and c2 can be changed by moving the mousecursor.
click here to try it or download the source
Calling R from Processing
Processing is a simple and powerfull programming language to create images, animation and interaction.
R is a powerfull free software environment for statistical computing.
For me this sounds like a perfect match. This is a short howto that shows how these two languages can comunicate with each other.
On the R-Side I use the Rserve extension, which can be installed by calling
install.packages("Rserve")
from within the R environment.
By calling
library(Rserve)
Rserve()
from within the R, you can start a serverprocess that accepts commands on a network socket and can be used by a javaclient to execute R commands.

In the processing sketch we need to add the two jar files of the javaclient that can be downloaded at the Rserve download page http://www.rforge.net/Rserve/files/
just add the jar files to the sketch using "Add file ..." from the "Sketch"-Menu.
Now we can use the REngine class to execute some R code in the server process and ask R to return the calculated data
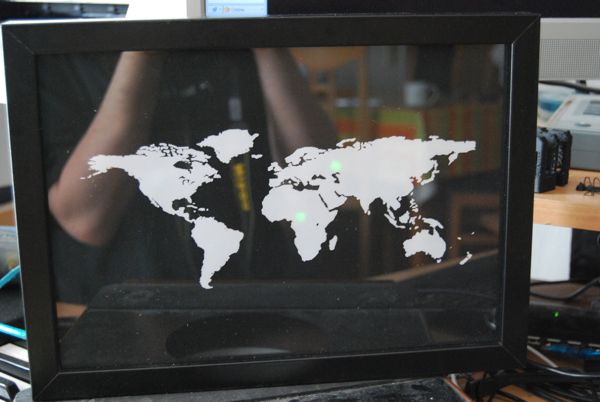
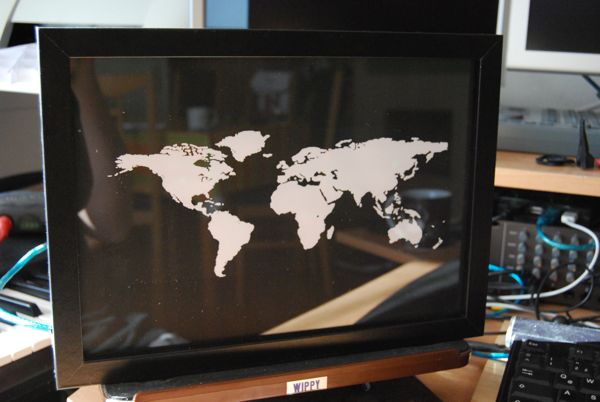
read more ...Blinking Logfile Map
I always wanted to see where the readers of my blog are comming from, so I took a picture frame and inserted a world map, a handfull of leds and an arduino. Some soldering and some rubyscripts later I had my hardware geo-aware logfile visualization.
I have a script running at the server that parses new ip adresses from the log file and geocodes them. Than the continent code is sent to my mac where i have a little script that forwards the continent code to the serial port. And finally the arduino in the picture frame is making the leds blink. The whole project was hacked together as a weekend project so the scripts might need some "fine-tuning" :-)
This is my day 5 project for 30DaysOfCreativity
so please read my blog to make the leds blink :-)
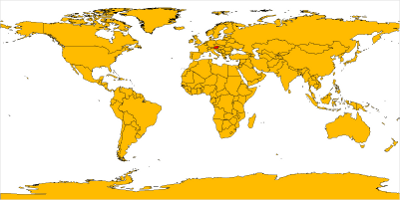
projecting GIS Data on a sphere using Processing
i have used processing to access map materials from geoserver. but i have noticed that the earth is not flat and that processing is making 3d animations really easy :-)
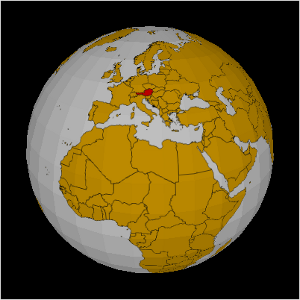
so i have coded a rotating sphere and project the GIS data from geoserver on the surface
flat map from my last sketch
spherical map from the new sketch
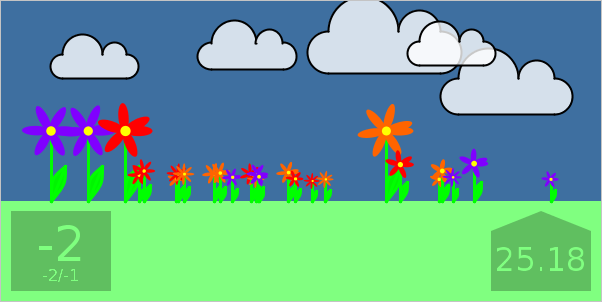
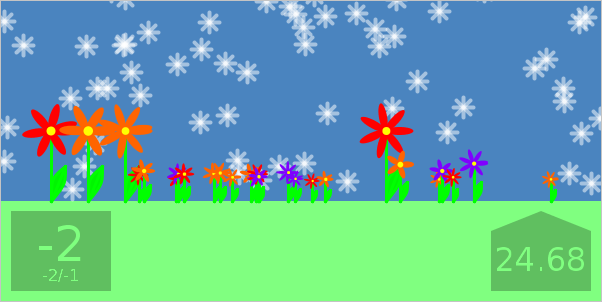
processing ical-flowers-2.0
I made a new version of the ical flowers sketch i wrote in dezember. This time it doesn't only show a flower for every event in my calender, it also shows
- the current weather (using the rubyweather library)
- the current temperature outside
- the min/max temperature outside
- the current temperature inside ( using my arduino i2c thermometer sketch)
- the sky color changes depending on the current time
the system consists of a ruby-proxy, an arduino sketch and a processing sketch.
the ruby proxy starts a web-server on port 2000. It fetches the current weather using the rubyweather gem, fetches the events from the configured caldav calenders, and fetches the current temperature from the arduino using ruby-serial
the arduino sketch is basicaly the same as in this blog post. the only change is that the arduino only sends the temperature when the host sends a 'C' over the serial line
the processing sketch finally fetches the data via http from the proxy and displays it ( using my icap4p library. the screen is updated every 1/2 hour using the method described here
the code can be downloaded here
it's published under the LGPL
have fun :-)
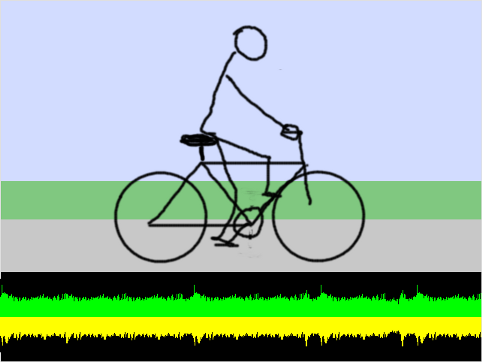
read more ...Training Bike Visualization
i wrote a processing sketch to visualize and record sessions on a training bike. To calculate the rotation-speed of my training bike i hooked up 2 reed-switches to my arduino and taped them to my training bike. Than i sticked a rare earth magnet on each pedal.
the processing sketch draws a small figure on a bike which is animated at the same speed as the bike.
the sketch also records the timestamps to a log file for later analysis.